Revenue Reporting
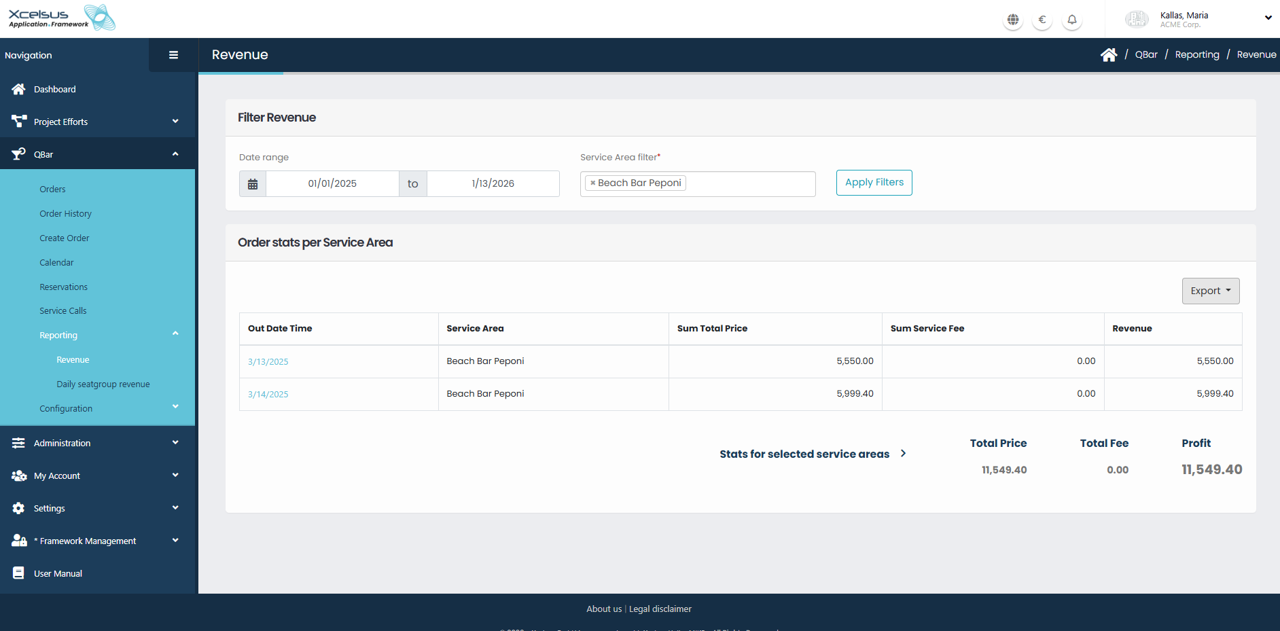
The Revenue screen provides an overview of revenue generated across service areas within a selected time period. This view is designed to help users quickly analyze total sales, service fees, and overall profit based on completed orders.
At the top of the page, the Filter Revenue section allows you to refine the data being displayed. You can select a date range by choosing a start and end date, and optionally limit the results to one or more service areas. Once the desired filters are set, click Apply Filters to refresh the report with the selected criteria.
Below the filters, the Order stats per Service Area table displays aggregated results grouped by service area and order date. Each row shows the total order price, total service fee, and resulting revenue for that service area on a specific date. This makes it easy to compare performance across different days or locations.
At the bottom of the table, a summary section displays combined totals for the selected service areas, including Total Price, Total Fee, and Profit. These values reflect the sum of all rows currently shown in the report. If needed, the data can be exported using the Export option for further analysis or record keeping.